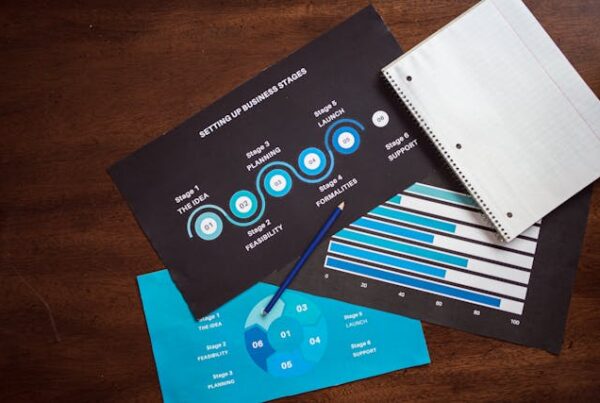
Creating authentic graphics with a clear message can take your marketing efforts to the next level! Infographics are a great way to spread your message creatively. This marketing tactic is seen everywhere and incorporated into a firm’s strategic plan. If you want to spice up your feed, while keeping it professional and informative, an infographic is an effective tactic.
Research
The most important aspect of your infographic is the message or information being expressed with the graphic. When establishing the message, it’s crucial to do extensive research on the topic at hand. If the information is not thoroughly investigated and still used, it can lead to misinformation which will ruin your brand credibility. Consumers that are reading the information should be able to trust it from the initial interaction. Therefore, there is no room for mistakes when it comes to researching the topic for your infographic. Not only does having specific information give your company a niche value, but it can also help a brand build up their SEO quality.
Graphics
Although the information is the bulk of your content, the graphic designs tied to it will work as the eye-catcher, getting people to stop and read your message. The imagery should be related to the information or topic. For example, if you are creating an infographic on facts about surfers in Rhode Island, it would be wise to incorporate cool tones, water imagery, surfboard texts boxes, or an interactive design of a wave motion, where information comes into the graphic. All these aspects are closely related to the topic, achieving a cohesive theme and message.
In today’s marketing world, people don’t want to read long essays or wordy black and white graphics. Trends that we see in today’s marketing should be introduced into creating infographics. The use of color and animations is a popular attention grabber for recent generations. Keep style in mind when developing an infographic of your own.
Types of Infographics
Infographics never come in a single shape or size. There are various types of infographics that are used for promotional efforts or to simply spread information. It’s important to choose an infographic format that is best fitted with the information at hand. Below are a few examples of types of infographics:
- List infographic.
- Statistical infographic.
- Map infographic.
- Timeline Infographic.
- Comparison infographic.
Each format is used for a particular area of information. A common format we see is the statistical infographic. Statistical is seen when trying to highlight numbers, data, or statistics. Incorporating statistics with a graphic is a great way to ensure consumers are seeing information that could be influential to a brand’s image or message. Another common format is the list infographic. List infographics do not express statistics or data but use a similar organizational style to list information clearly and concisely.
The flexibility that comes with any infographic is exactly what makes them an amazing tool for marketing companies and businesses to utilize. Regardless of what kind of message you are aiming to spread its key to know your audience and tailor your infographics from there. Get creative and stay clear in your message and you can produce exceptional infographics for your audience.


